Student Wellbeing for Learning

Pivot Wellbeing provides evidence of the conditions that enable learning

Pivot Wellbeing provides evidence of the conditions that enable learning

Pivot Wellbeing provides evidence of the conditions that enable learning

Weekly check-ins on the conditions that shape readiness to learn, that only take about a minute per student to complete.

Weekly check-ins on the conditions that shape readiness to learn, that only take about a minute per student to complete.

Book a pilot

Start Your Free Trial

pivot-wellbeing-hero-image

What the schools need

By the time it shows up in attendance, you are already behind

By the time it shows up in attendance, you are already behind

By the time it shows up in attendance, you are already behind

Disengagement is visible early, but not in the data most schools collect. It shows up as a student who has stopped putting their hand up, six weeks before they stop turning up.

Disengagement is visible early, but not in the data most schools collect. It shows up as a student who has stopped putting their hand up, six weeks before they stop turning up.

Disengagement is visible early, but not in the data most schools collect. It shows up as a student who has stopped putting their hand up, six weeks before they stop turning up.

Annual wellbeing surveys only tell you what your school was like last year.

Annual wellbeing surveys only tell you what your school was like last year.

Annual wellbeing surveys only tell you what your school was like last year.

STUDENTS ATTENDING 90 PER CENT OF THE TIME

STUDENTS ATTENDING 90 PER CENT OF THE TIME

2019

2019

2019

73.1%

73.1%

73.1%

2024

2024

2024

59.8%

59.8%

59.8%

Nationally, the share of students in Years 1 to 10 attending at least 90 per cent of school days fell 13.3 percentage points between 2019 and 2024. Attendance rates have not returned to pre-COVID levels, and ACARA reports a downward trend of 0.5 percentage points a year across 2015 to 2025.

Nationally, the share of students in Years 1 to 10 attending at least 90 per cent of school days fell 13.3 percentage points between 2019 and 2024. Attendance rates have not returned to pre-COVID levels, and ACARA reports a downward trend of 0.5 percentage points a year across 2015 to 2025.

Nationally, the share of students in Years 1 to 10 attending at least 90 per cent of school days fell 13.3 percentage points between 2019 and 2024. Attendance rates have not returned to pre-COVID levels, and ACARA reports a downward trend of 0.5 percentage points a year across 2015 to 2025.

What it measures

Five factors, asked often enough to matter

Five factors, asked often enough to matter

01

General wellbeing

How a student is travelling overall, in their own words rather than a staff judgement.

02

Resilience

Whether a student can stay with something difficult, and recover when it does not go well.

03

Belonging

Whether a student believes they are known here, and that this is a place for them.

04

Safety

Whether a student feels physically and socially safe in the places they have to be.

05

Protective behaviours

Whether a student knows what to do and who to go to when something is wrong.

Cadence

Baseline, then weekly

Baseline

Baseline

A fuller survey at the start of a term or year, establishing where each cohort sits across the five factors.

A fuller survey at the start of a term or year, establishing where each cohort sits across the five factors.

Weekly

Weekly

About a minute per student. Short enough to run in roll call, often enough to show movement rather than a snapshot.

About a minute per student. Short enough to run in roll call, often enough to show movement rather than a snapshot.

You set it

You set it

Run it weekly, fortnightly or by term. The tool stays the same, so every round is comparable with the last.

Run it weekly, fortnightly or by term. The tool stays the same, so every round is comparable with the last.

Age-appropriate versions

Three versions, one measure

Foundation to Yr 2

Foundation to Yr 2

Simplified language and a visual response scale, built for emerging readers.

Simplified language and a visual response scale, built for emerging readers.

Years

3 to 6

Which teams already carry a practice well, so the professional learning can come from inside the building.

Which teams already carry a practice well, so the professional learning can come from inside the building.

Years

7 to 13

Where a practice thins out as students move up the school, which a whole-school figure hides completely.

Where a practice thins out as students move up the school, which a whole-school figure hides completely.

The factors do not change between versions, so a cohort stays comparable as it moves through the school.

The factors do not change between versions, so a cohort stays comparable as it moves through the school.

Data and reach out

A student surfaces two ways: in the data, or by putting their hand up

A student surfaces two ways: in the data, or by putting their hand up

A student surfaces two ways: in the data, or by putting their hand up

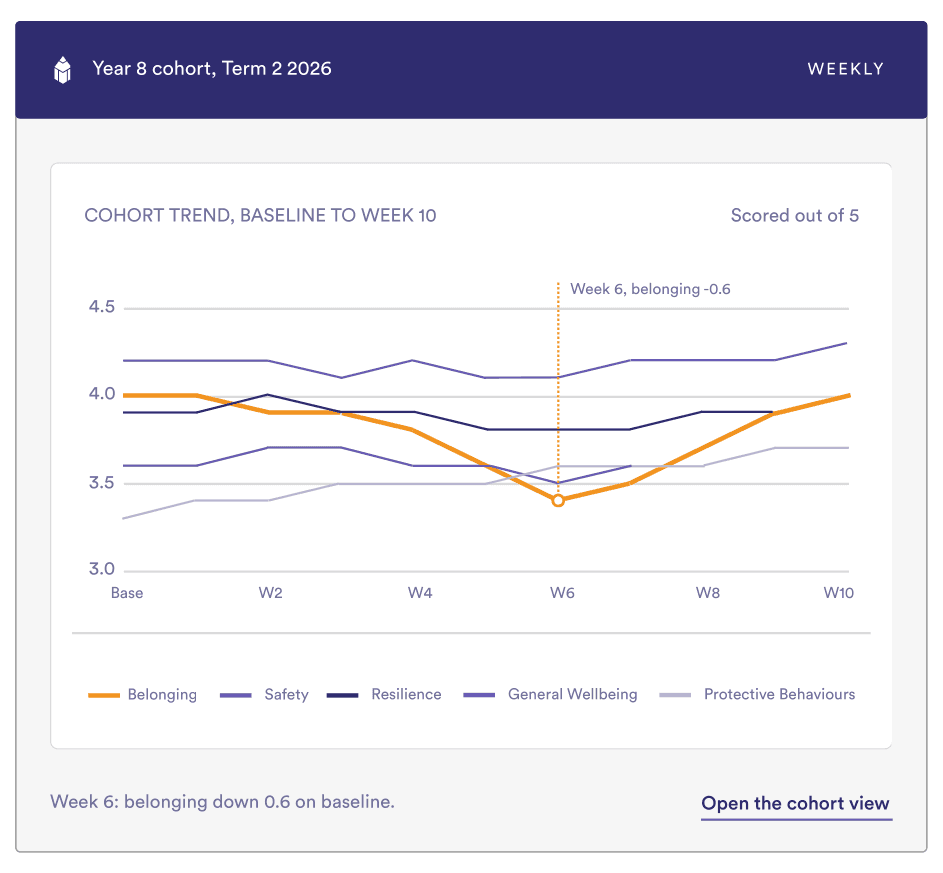
The two work together. The trend tells you where to look across a cohort. The ‘Reach Out’ feature tells you when one student has decided, on their own terms, that this is the week they want someone to know.

The two work together. The trend tells you where to look across a cohort. The ‘Reach Out’ feature tells you when one student has decided, on their own terms, that this is the week they want someone to know.

The two work together. The trend tells you where to look across a cohort. The ‘Reach Out’ feature tells you when one student has decided, on their own terms, that this is the week they want someone to know.

The data

Longitudinal tracking

Longitudinal tracking

Longitudinal tracking

Every round is comparable with the last, so a factor moving against its own baseline is visible as movement rather than as a number in isolation. That is what lets you see a cohort drifting in week six instead of reading about it in the attendance data in week twelve.

Every round is comparable with the last, so a factor moving against its own baseline is visible as movement rather than as a number in isolation. That is what lets you see a cohort drifting in week six instead of reading about it in the attendance data in week twelve.

Every round is comparable with the last, so a factor moving against its own baseline is visible as movement rather than as a number in isolation. That is what lets you see a cohort drifting in week six instead of reading about it in the attendance data in week twelve.

Reach Out

A student can raise their hand inside the check-in

A student can raise their hand inside the check-in

A student can raise their hand inside the check-in

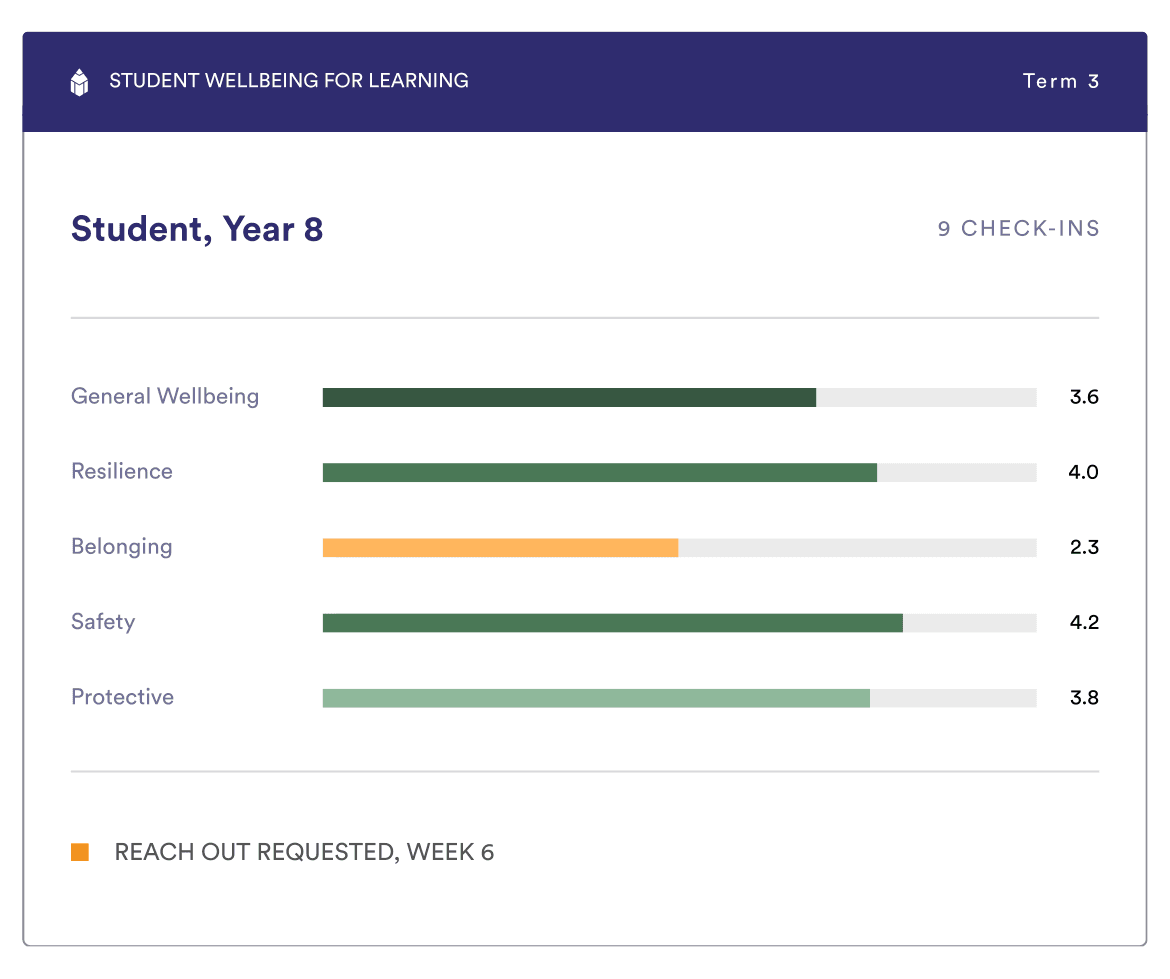
Any student can ask to speak to someone as part of the weekly check-in, without having to find a moment, pick a staff member, or say it out loud in front of a class.

Any student can ask to speak to someone as part of the weekly check-in, without having to find a moment, pick a staff member, or say it out loud in front of a class.

Any student can ask to speak to someone as part of the weekly check-in, without having to find a moment, pick a staff member, or say it out loud in front of a class.

This matters most for the students who would never approach a teacher directly. Reach Out gives them a door that does not require them to be the sort of student who knocks.

This matters most for the students who would never approach a teacher directly. Reach Out gives them a door that does not require them to be the sort of student who knocks.

Student Profiles

See trends at a whole school, cohort, or individual student level

See trends at a whole school, cohort, or individual student level

See trends at a whole school, cohort, or individual student level

The same evidence base, read at three magnifications. A whole-school view for the leadership team, a cohort view for the year level leader, and an individual student profile for the person sitting down with that student's family.


Each student profile carries their trend across the five factors over time, alongside any Reach Out requests, so a wellbeing conversation starts from a history rather than from this week.

The same evidence base, read at three magnifications. A whole-school view for the leadership team, a cohort view for the year level leader, and an individual student profile for the person sitting down with that student's family.


Each student profile carries their trend across the five factors over time, alongside any Reach Out requests, so a wellbeing conversation starts from a history rather than from this week.

pivot-wellbeing-studentY8

From signal to support

We surface where to look. Your team decides what to do.

We surface where to look. Your team decides what to do.

We surface where to look. Your team decides what to do.

What Pivot does

Reports the pattern over time, by cohort and by class, and flags where a factor has moved against its own baseline.


Puts that in front of the people who already hold duty of care, in a form they can act on in a meeting.

Passes a Reach Out request straight to the staff who hold that student's care.

What your team does

Decides what a signal means in your context, who follows it up, and what support looks like for that student or that cohort.


Keeps the referral pathways and escalation processes you already have. Pivot fits inside them rather than replacing them.

What Pivot is not

Pivot is not a clinical tool and does not diagnose.


It does not screen for mental health conditions, produce a risk score for an individual child, or replace the judgement of a wellbeing professional.

Evidence

Built with specialists, aligned to the national framework

Built with specialists, aligned to the national framework

Built with specialists, aligned to the national framework

The five factors are aligned to the Australian Student Wellbeing Framework, so what you measure maps to the language your school already uses to plan and report on wellbeing.

The five factors are aligned to the Australian Student Wellbeing Framework, so what you measure maps to the language your school already uses to plan and report on wellbeing.

Developed with wellbeing specialists, and deliberately scoped to stop where their professional judgement starts.

Developed with wellbeing specialists, and deliberately scoped to stop where their professional judgement starts.

FRAMEWORK

Aligned to the Australian Student Wellbeing Framework, and reported in its terms so the evidence drops into your wellbeing plan without translation.

Aligned to the Australian Student Wellbeing Framework, and reported in its terms so the evidence drops into your wellbeing plan without translation.

Aligned to the Australian Student Wellbeing Framework, and reported in its terms so the evidence drops into your wellbeing plan without translation.

SECURITY AND PRIVACY

ST4S, with Australian data residency.

ST4S, with Australian data residency.

ST4S, with Australian data residency.

DUTY OF CARE

DUTY OF CARE

Clear escalation and duty-of-care handling, agreed with your wellbeing lead and documented before the first survey runs.

Clear escalation and duty-of-care handling, agreed with your wellbeing lead and documented before the first survey runs.

Clear escalation and duty-of-care handling, agreed with your wellbeing lead and documented before the first survey runs.

Proof

Listening every week, not once a year

Listening every week, not once a year

Listening every week, not once a year

Be proactive with student wellbeing

Be proactive with student wellbeing